Relative velocity
A bounded linear multiplier captures relative impact speed.
CVPR 2026 · Simulation for Autonomous Driving Workshop
Unveiling the Safety Illusion in
Autonomous Driving Simulation
The University of Hong Kong
01 / The safety illusion
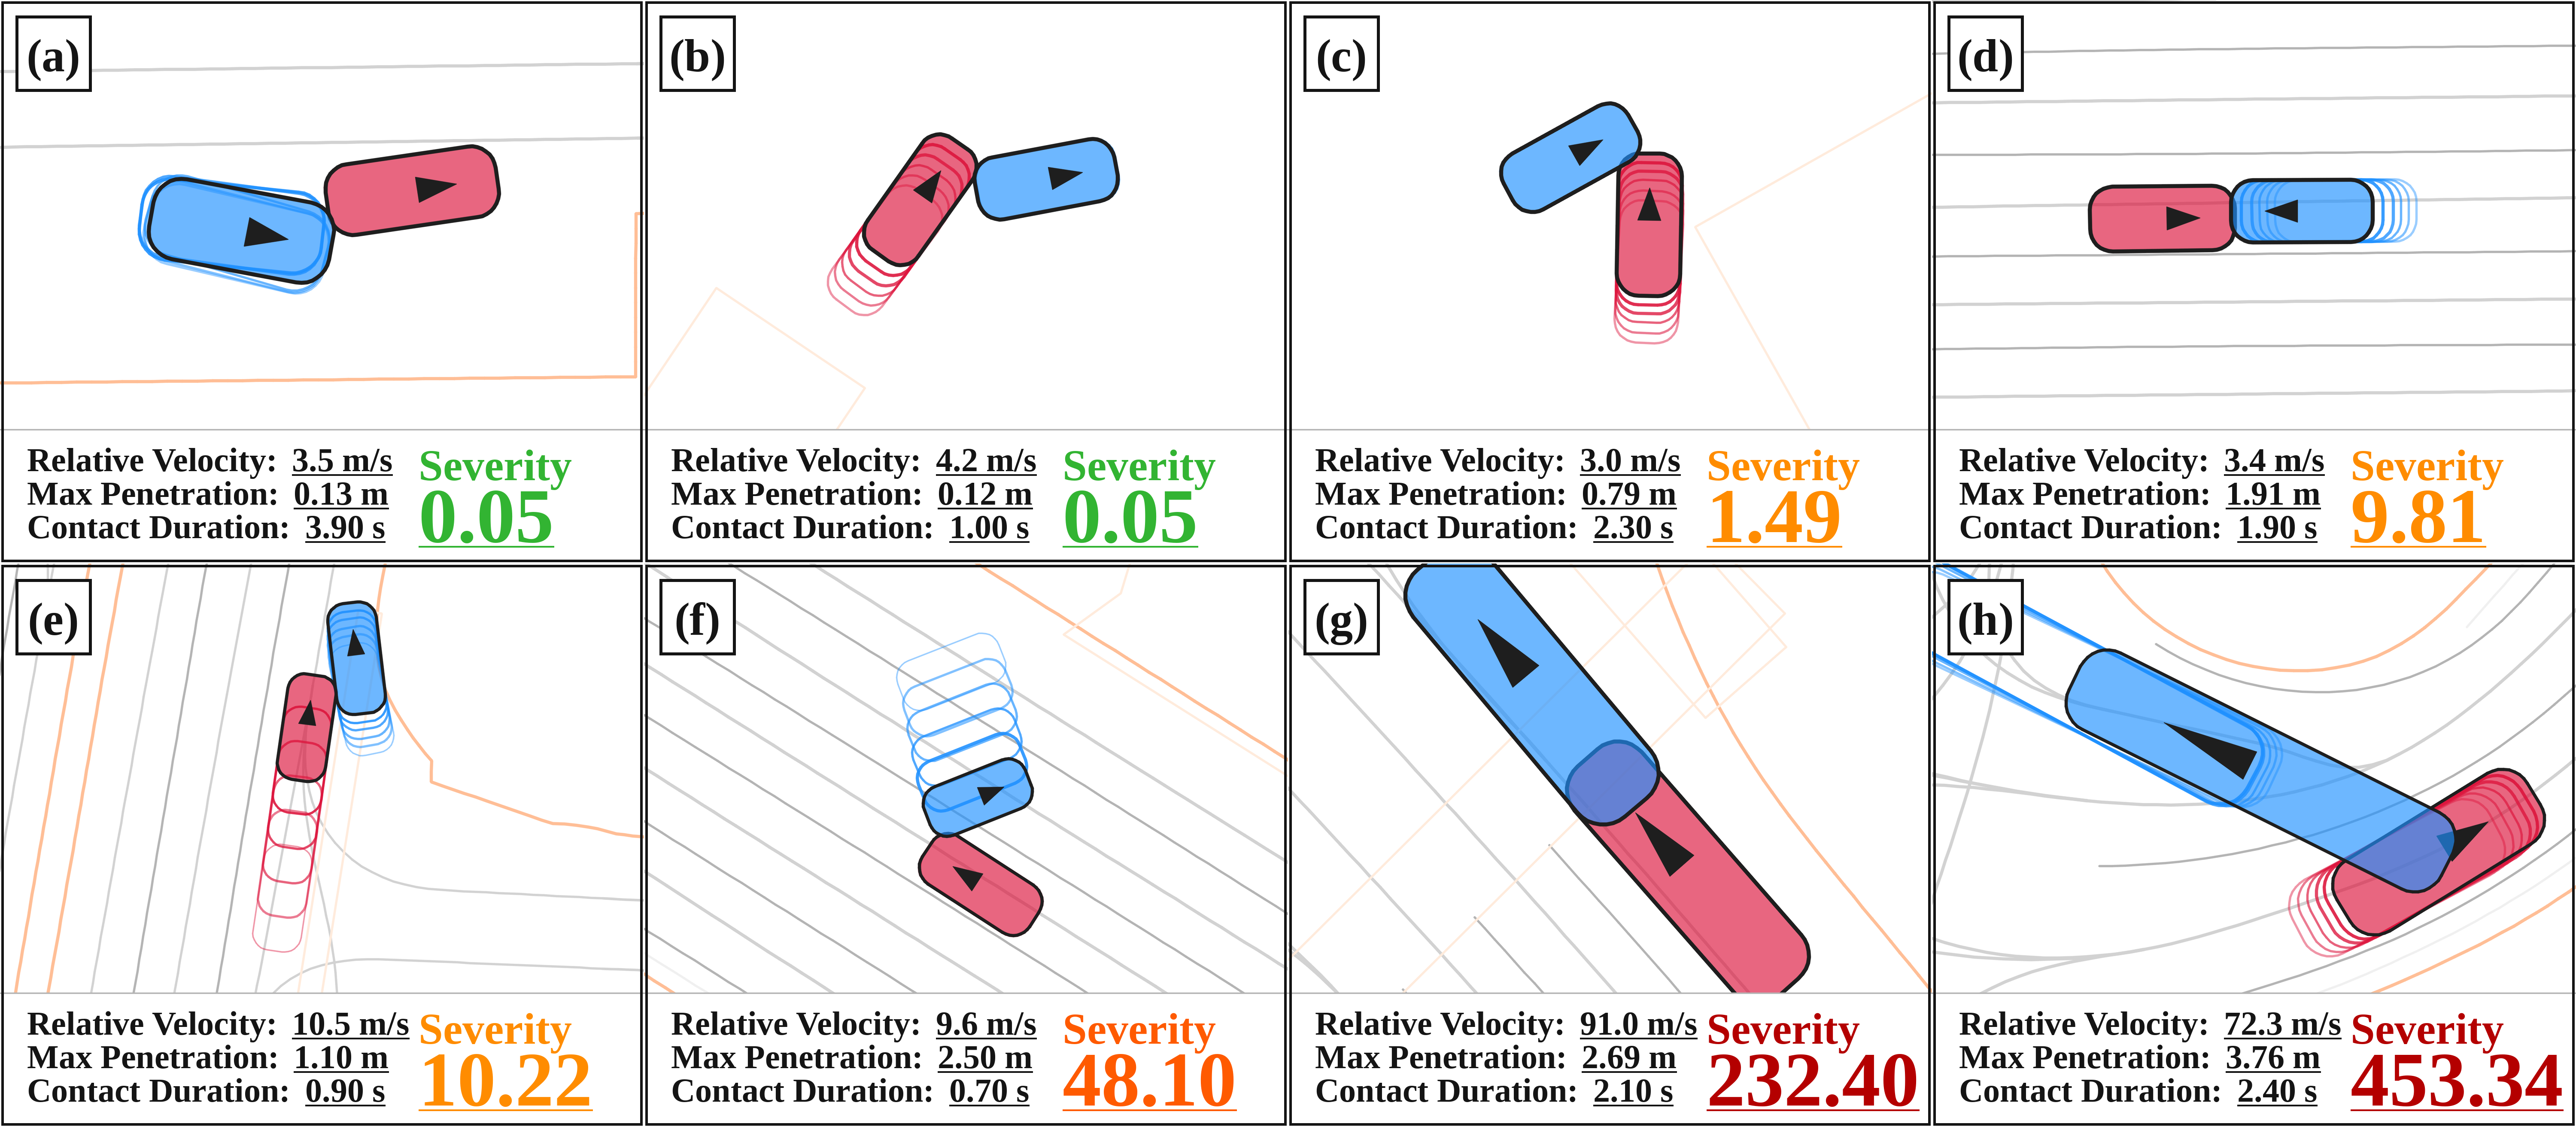
Binary collision labels collapse very different events into the same outcome. Bounding-box jitter, a brief contact, and a high-speed collision can all be recorded as a collision. A similar collision rate can therefore conceal very different severity distributions.
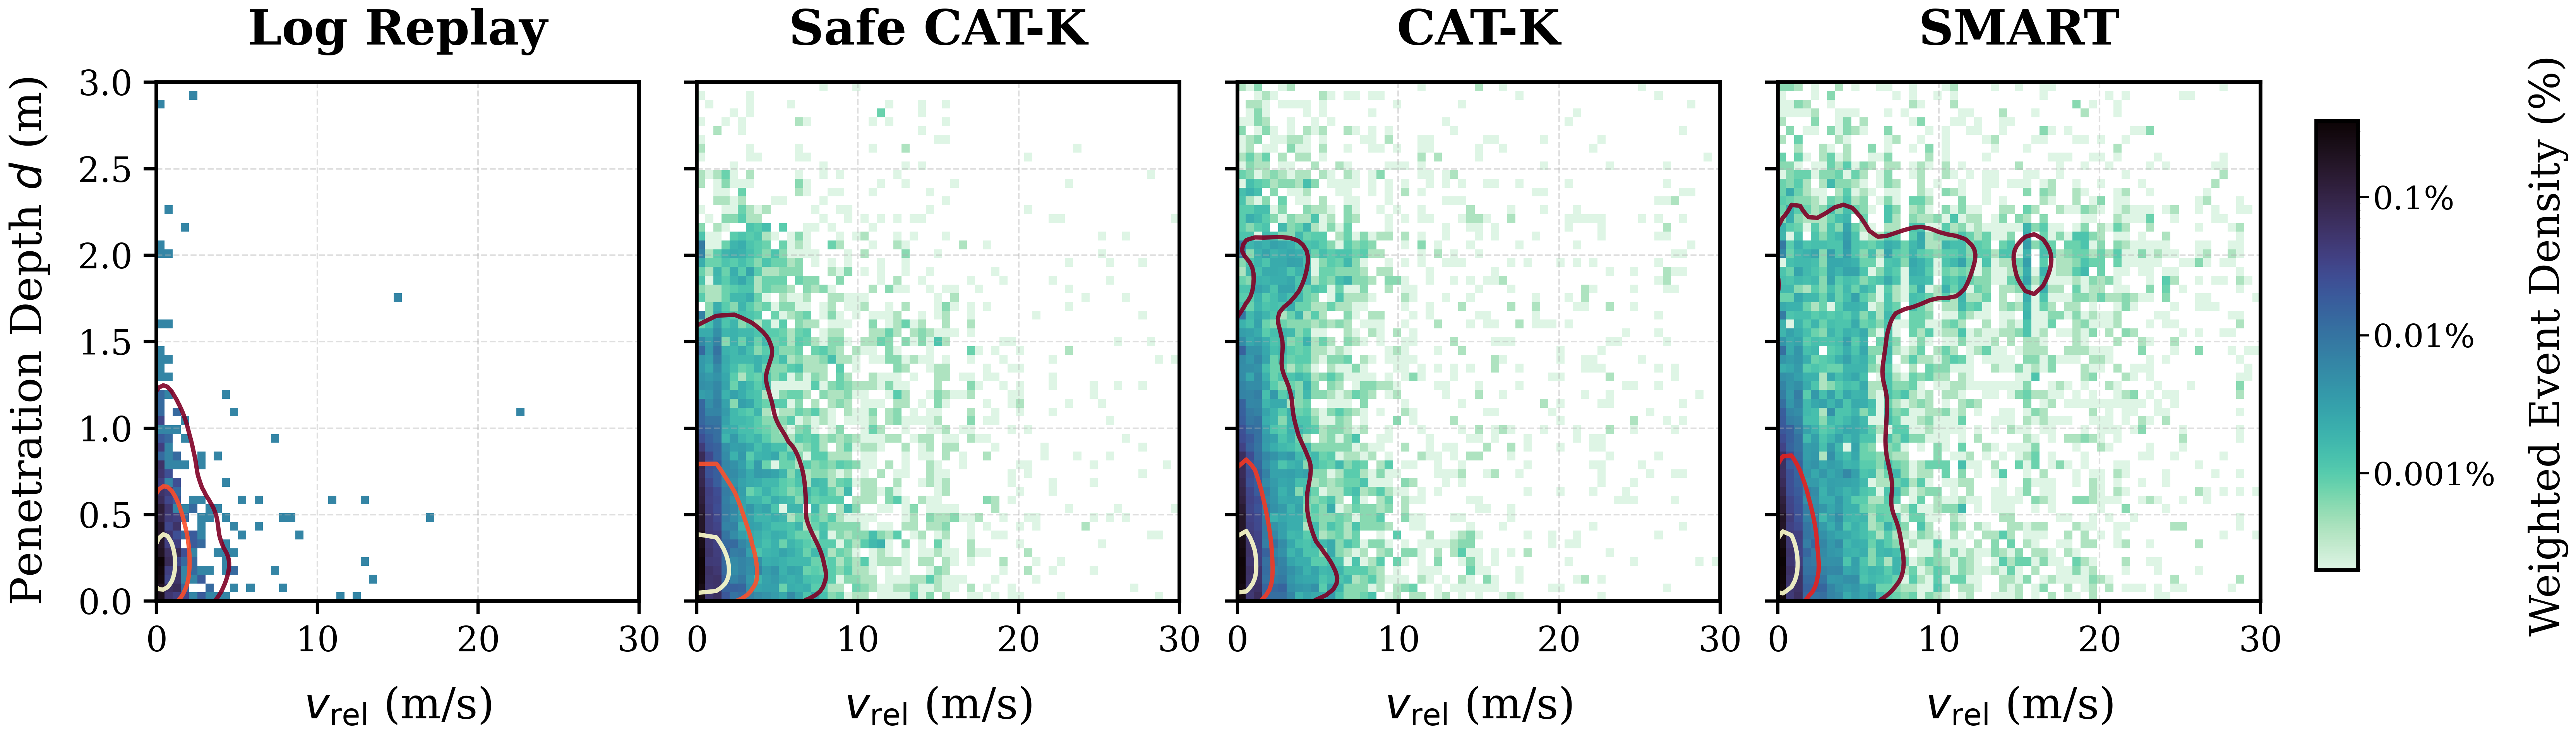
We study the gap between benchmark-facing realism and physical risk in autonomous driving simulation. Composite Severity Analysis represents collisions through impact velocity, penetration depth, and contact duration. The Composite Collision Metric (CCM) then summarizes severe outcomes in the tail of the distribution.
02 / Composite Collision Metric
A bounded linear multiplier captures relative impact speed.
A quadratic penalty emphasizes structural penetration.
A temporal gate filters brief contact noise and saturates for sustained contact.
For each collision event, vrel is relative impact velocity, d is penetration depth, and Δt is contact duration. The functions m, δ, and g convert these quantities into severity factors.
Default parameters: vref = 5.0 m/s, dref = 0.5 m, vmin = 1.0 m/s, vmax = 40.0 m/s, tres = 0.1 s, tnoise = 0.2 s, and ε = 10−4.
Events are filtered before severity scoring: pedestrian–pedestrian contacts and pedestrian–vehicle contacts where the pedestrian's impact speed exceeds the vehicle's are excluded.
Unconditional tail risk
Collision-free instances receive S = 0. CCM evaluates the worst 5% of the global severity distribution, capturing both collision frequency and consequence severity.
95% of instances Worst 5%
The paper separately reports conditional CVaR95 over meaningful collisions (C = 1), which describes severity within the collision subset:
03 / Results on WOSAC
Safety-oriented rejection sampling in Safe CAT-K reduces CCM from 2.792 to 1.611, while collision likelihood changes only slightly.
| Model | Collision likelihood ↑ | Original collision rate (%) ↓ | Inter-vehicle collision rate (%) ↓ | CCM ↓ |
|---|---|---|---|---|
| Log Replay | — | 4.69 | 0.72 | 0.028 |
| SMART | 0.9643 | 6.75 | 2.36 | 5.557 |
| CAT-K | 0.9672 | 6.16 | 1.62 | 2.792 |
| Safe CAT-K | 0.9637 | 6.23 | 1.51 | 1.611 |
04 / Qualitative examples
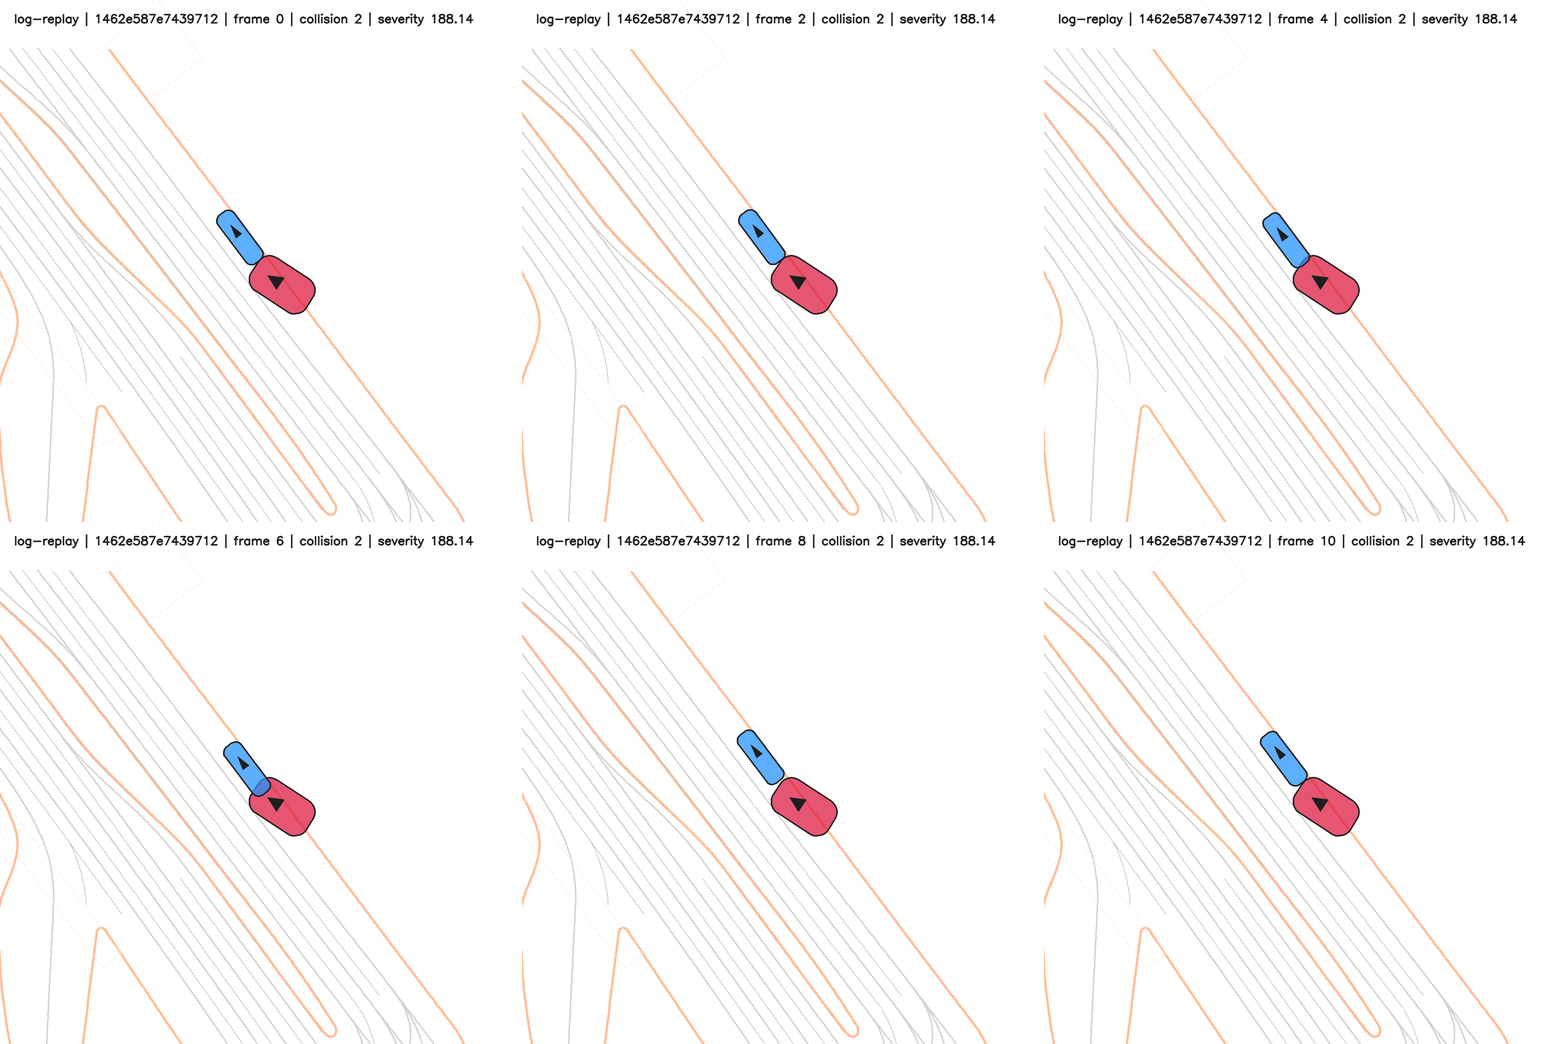
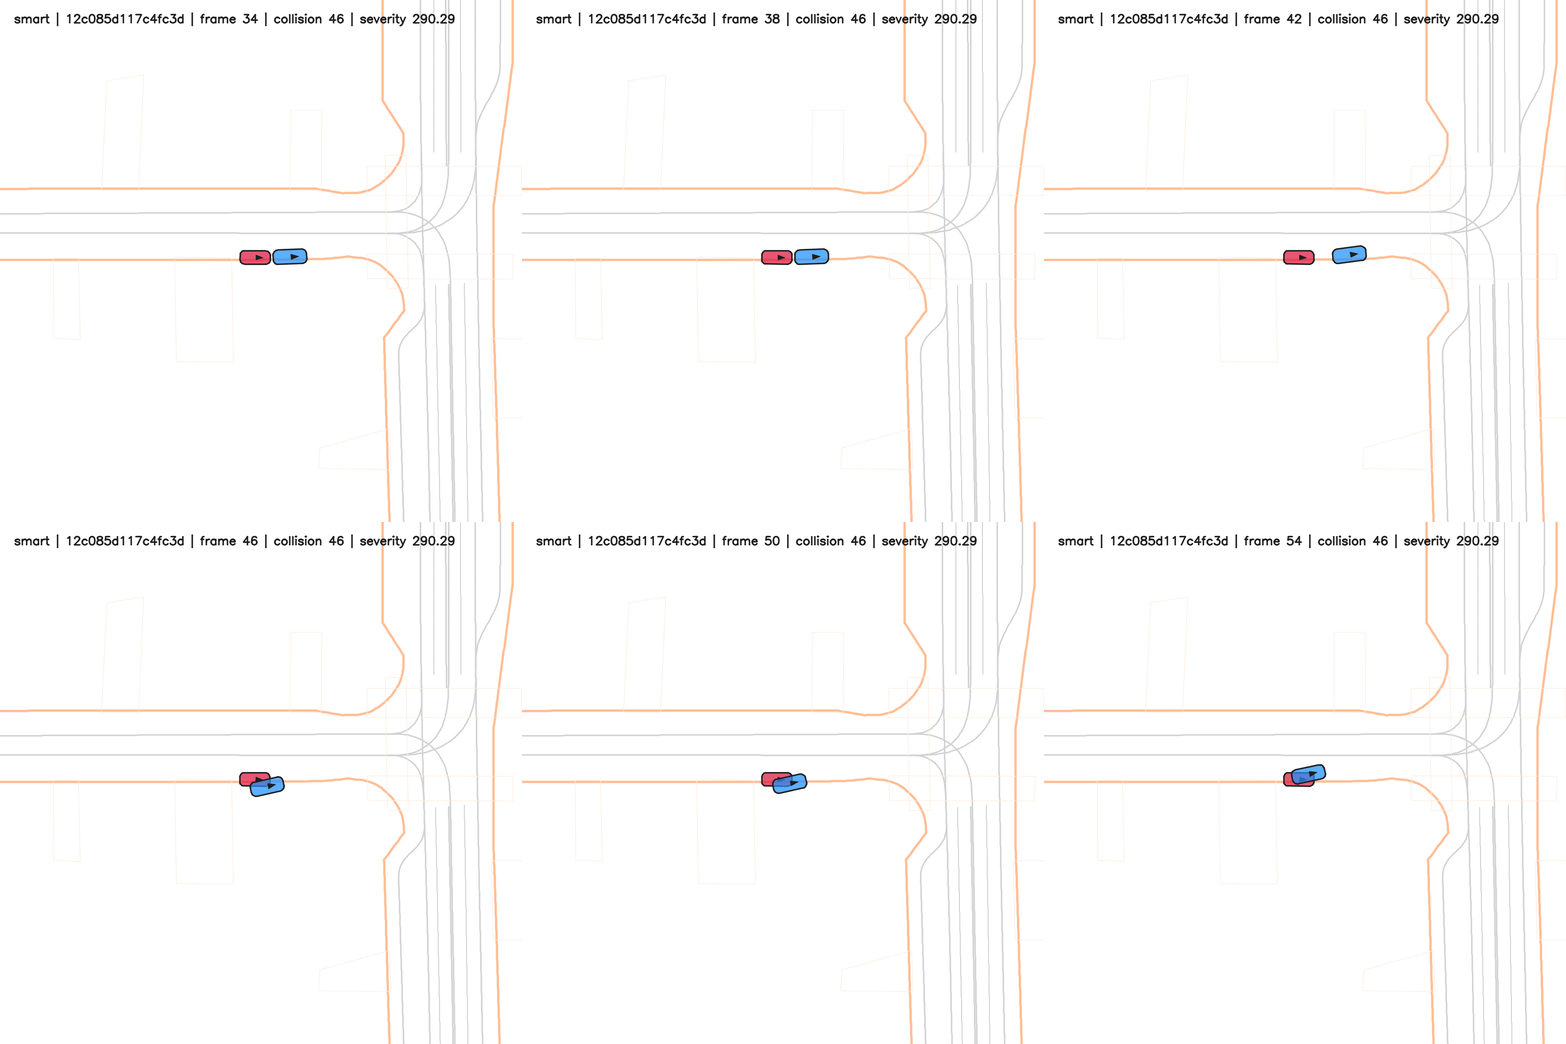
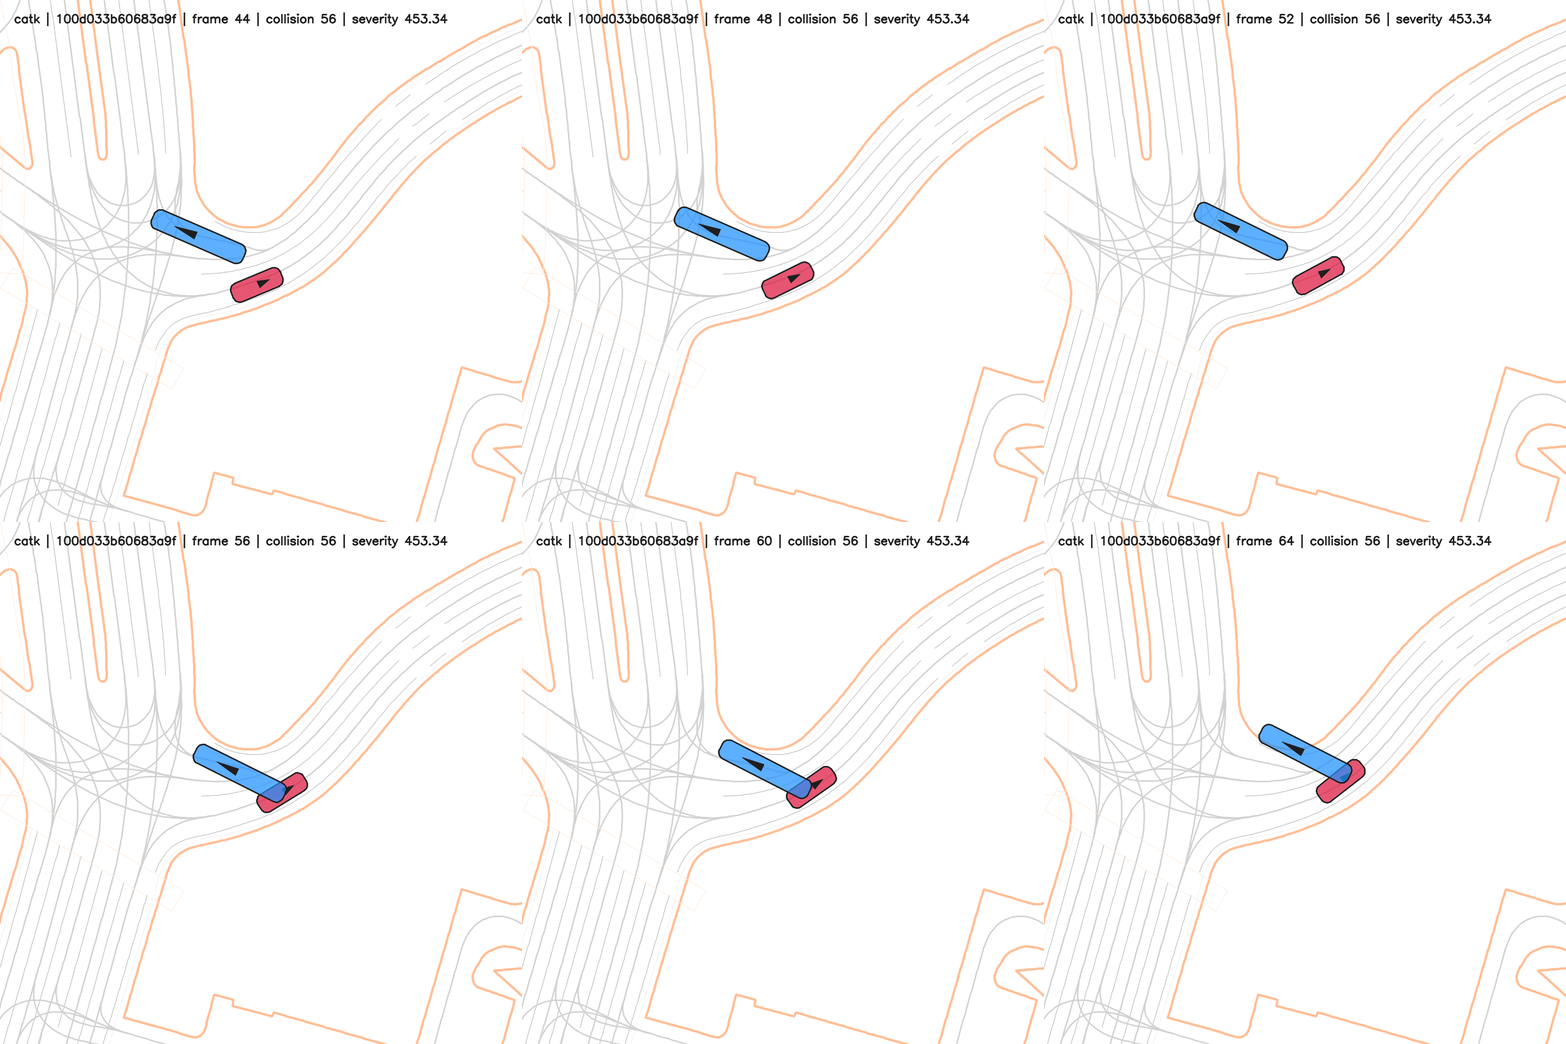
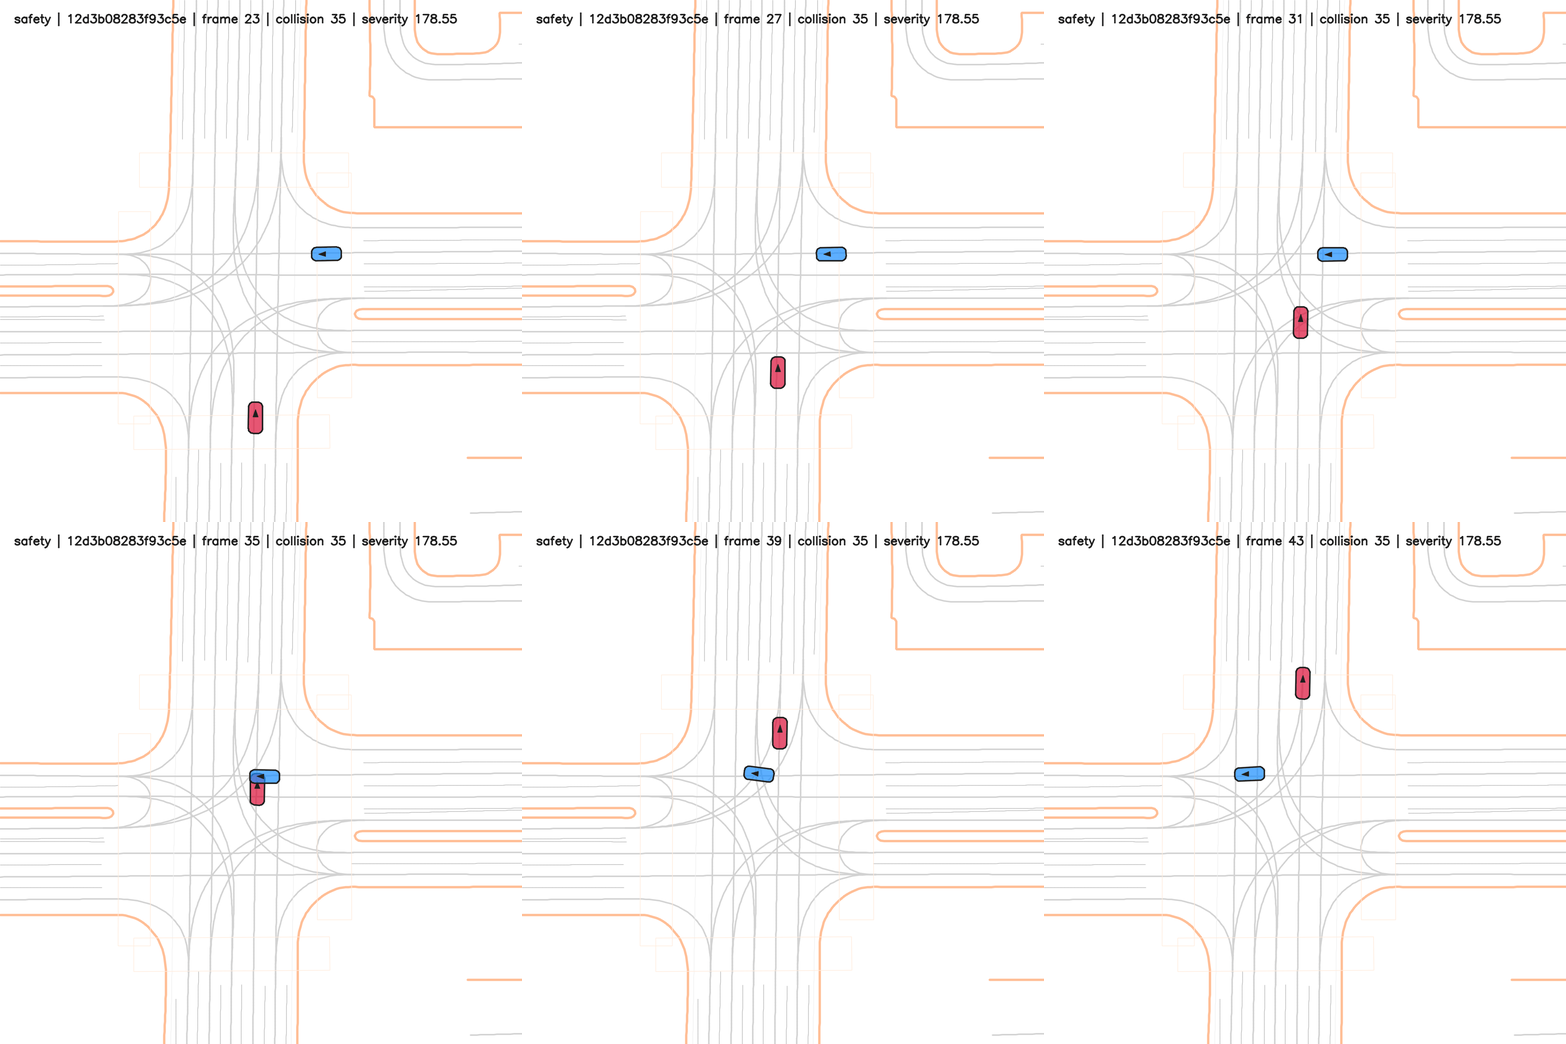
Selected collision scenarios illustrating vehicle interactions and contact dynamics.
05 / Poster
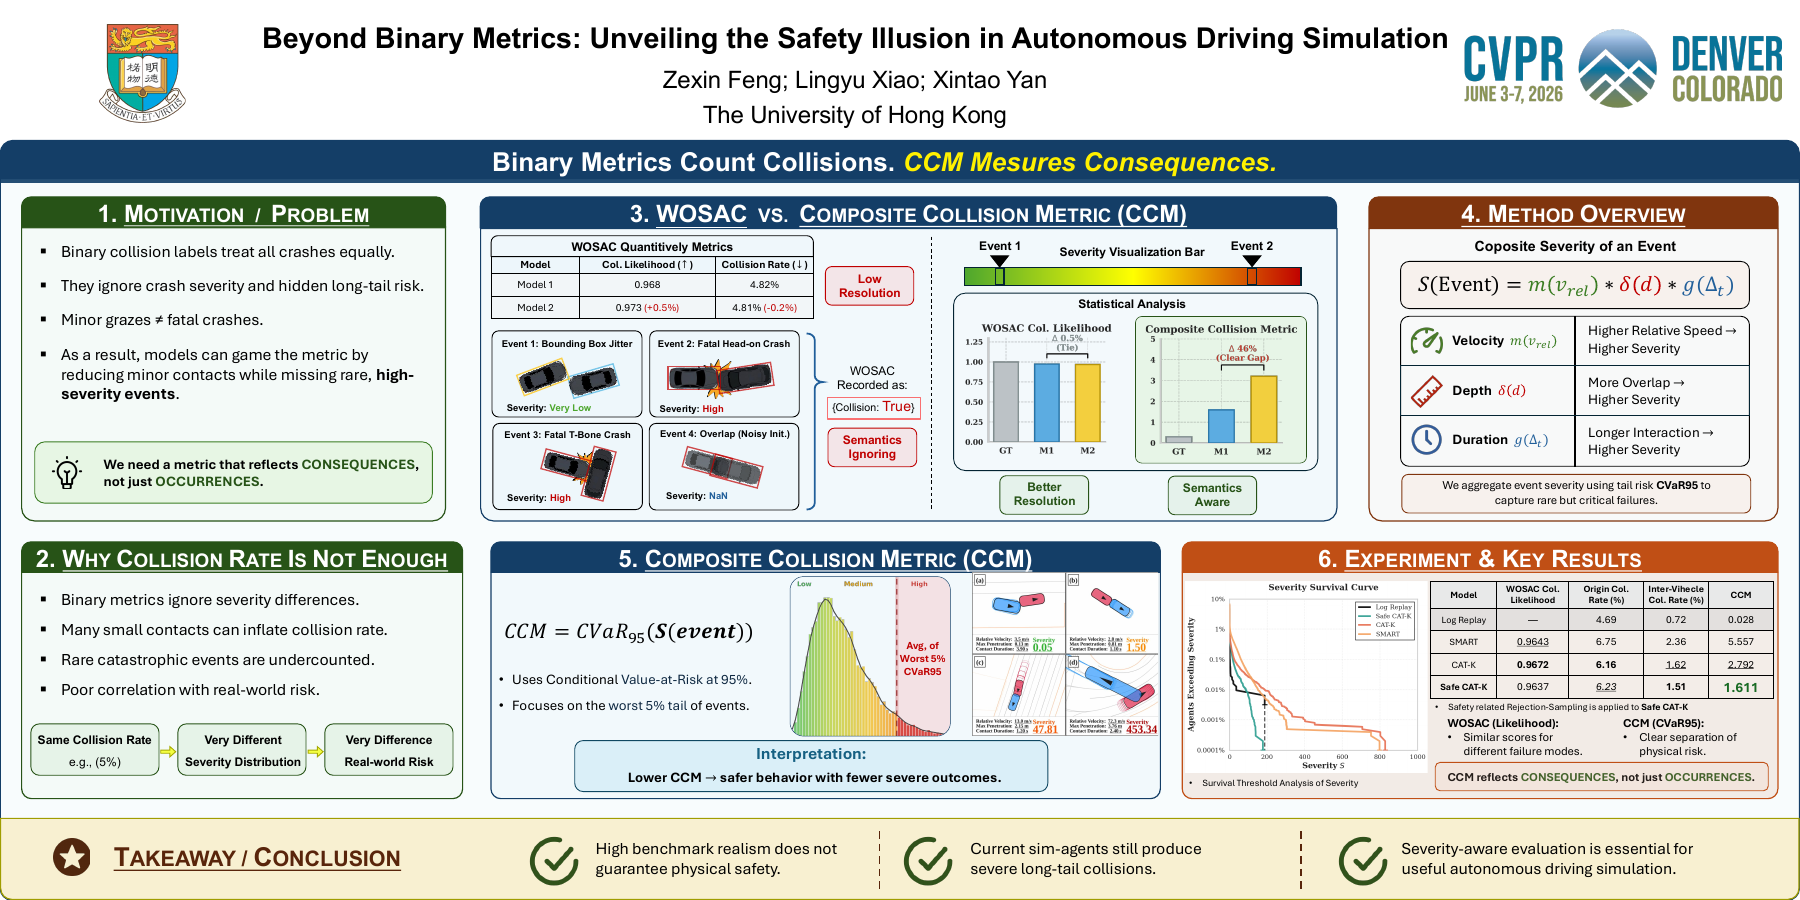
Severity-aware evaluation reveals rare, consequential failures that binary collision rates can hide.
Read the paper ↗